Turning data chaos into clear decisions.
My career so far has grown through data analysis, BI development and business consulting. Across different industries and problems, a recurring theme is that data only delivers real impact when it's tied to user experience and pain points. This drew me towards UX-led practices, and CPD to strengthen them in my approach.
This portfolio shows what makes me tick, to complement the more traditional project listings in my LinkedIn and CV. Each section demonstrates how I research a problem, identify the gap(s), and produce a meaningful, useful solution.

Hi, I'm Shannon
See what I've been working on
NHS patient record systems hold a lot of personal data, but finding it—and making sense of it—takes more effort than it should. Consultant notes, test results and medical advice are split between GP, hospital and third-party systems and often at different levels of currentness; then, what patients see is often in clinical language with little support for what to do next or for ongoing self-management.
Three core issues inspired this work:
- Siloed systems creating gaps in care
- Fragmented medical history with inconsistent record sharing
- Test reference ranges that compare everyone against healthy population averages without personal context
Four design hypotheses guided choices throughout:
- Patients who have a consolidated view of their medical records will feel more in control of their health and be better equipped to act on it
- Patients who can easily understand their health data will engage with it more frequently and take more proactive steps to manage their health
- Structuring navigation around how patients think—rather than how NHS systems are organised—will reduce drop-offs and increase engagement
- Combining GP and hospital records into a unified experience will reduce confusion and improve patients' confidence that they're getting a full health picture
Assumption: This project assumes that Operational Data Stores and APIs exist to support data requirements. Most example data included later can be found currently in different NHS Trust healthcare apps, so this seems reasonable but I don't have access to real database sources to verify it directly.
As someone who already interacts with national healthcare online services in different settings, the main goal that stood out was to reduce faff/friction. Putting my consultant hat on to rephrase this resulted in the following, more measurable outcomes:
- Medical records from all care settings are combined into an aggregated view within a single user experience
- Service features and functionality are organised in order of access frequency and typical session task steps
- Service navigation is simplified via enhanced grouping and categorisation of information (date chronology; type; health condition, etc)
- Increased support for self-education and management exists within the user experience
- Feature entry and exit points are more intuitive
I started with a Lean UX canvas to write out the project base more concretely before any design work.
The next thing needed was user input to confirm or alter these so, alongside opportunistic conversations and note-taking in daily life, I set up an 11-question survey (covering 13 data points) in Microsoft Forms and distributed it across a varied recruitment pool:
- Online community members via Nextdoor and LinkedIn
- Personal and professional contacts via Slack and WhatsApp
- Analytics & UX design course classmates
- Friends and family
- Coworking office peers (incentivised with free chocolate)
- Members of the public (also incentivised with free chocolate)
Survey submissions were kept anonymous and questions brief to avoid respondent fatigue. Questions focused on:
- Healthcare app (NHS/other) access frequency
- Ease of use
- Usage habits
- Confidence in understanding
- Level of data ownership
- Open-ended improvement suggestions


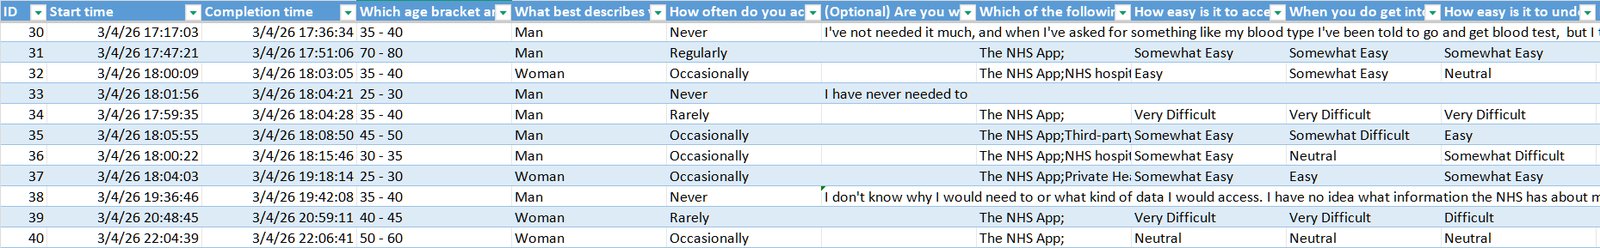
I exported the first batch of raw survey responses into Excel once I hit around 50 and performed basic checks and data profiling:
- Assessing survey response population and alignment with the questions
- Checking for low effort responses (straightlining; partial completions)
- Reviewing free-text responses for PII and/or inappropriate content
Next, I considered how to prepare the data for reporting: leave it in flat CSV format or structure it into separate tables for more detailed transformation later. I decided on a Kimball-based model for improved Power BI capability, and implemented this, initially keeping the data in Excel.
A couple things learnt at this stage:
- Microsoft forms can't be as easily integrated with third-party software as other survey tools (Google Forms, SurveyMonkey, Tally, etc.) if you're a personal (non-business) user
- Use of multi-choice and multi-select response questions with inline "Other" options will make data transformation more complex
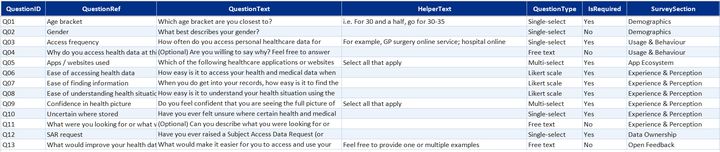
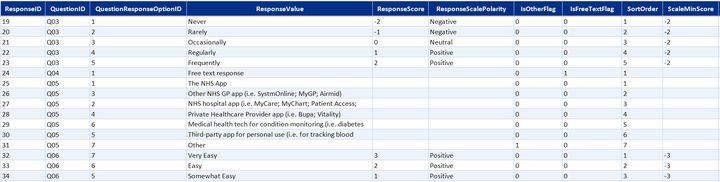
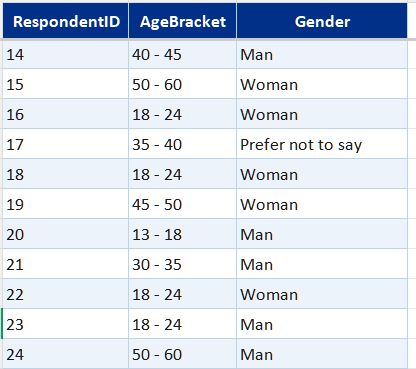
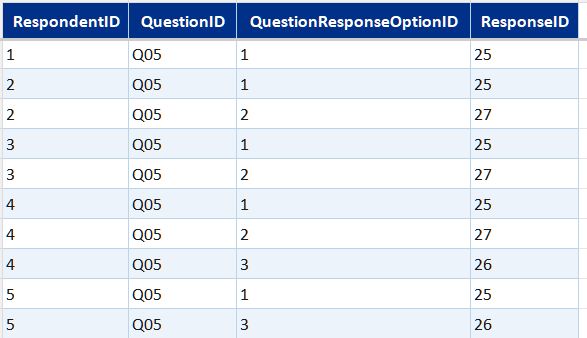
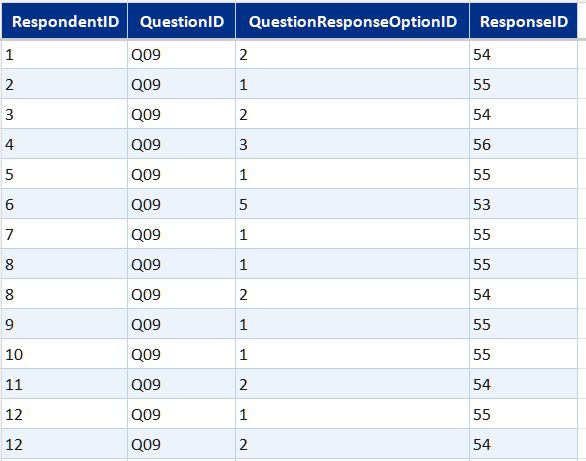
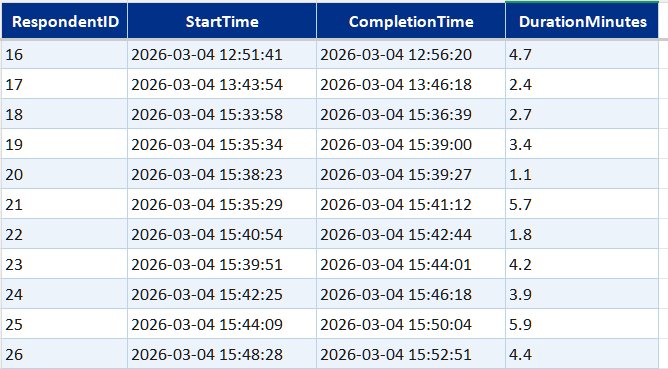
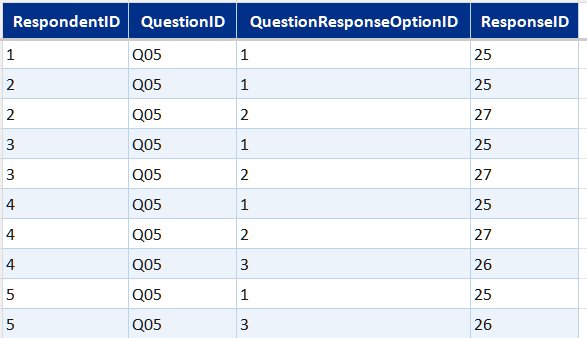
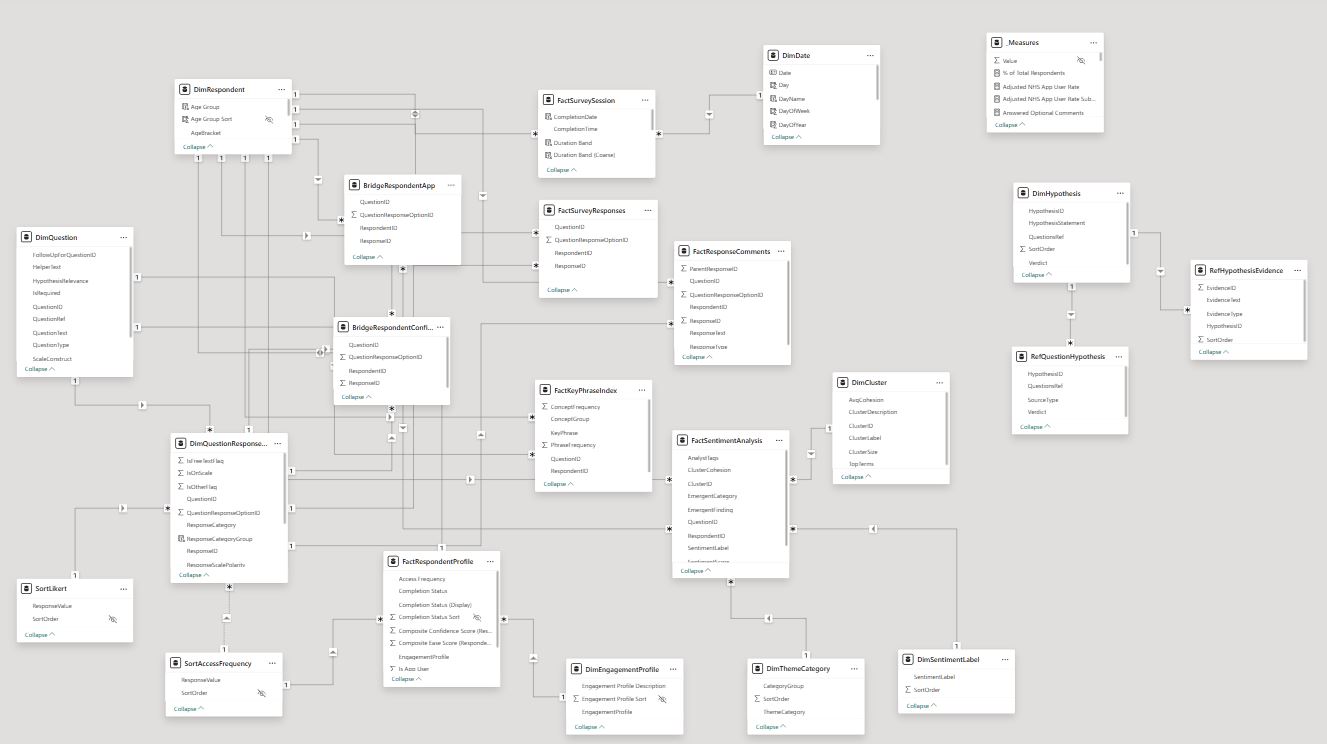
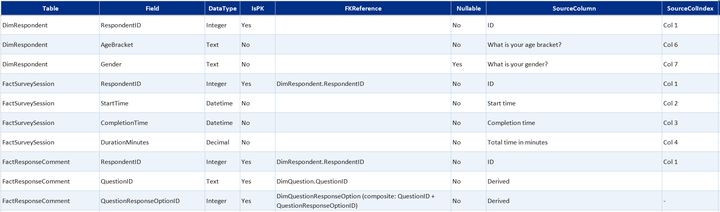
Survey data table summaryexpand
Core data model built in Excel from the Microsoft Forms export. Covers who responded, what they answered, and what they wrote.
- DimRespondent—one row per respondent; age bracket, gender, and access frequency
- DimDate—standard calendar table for time-based filtering
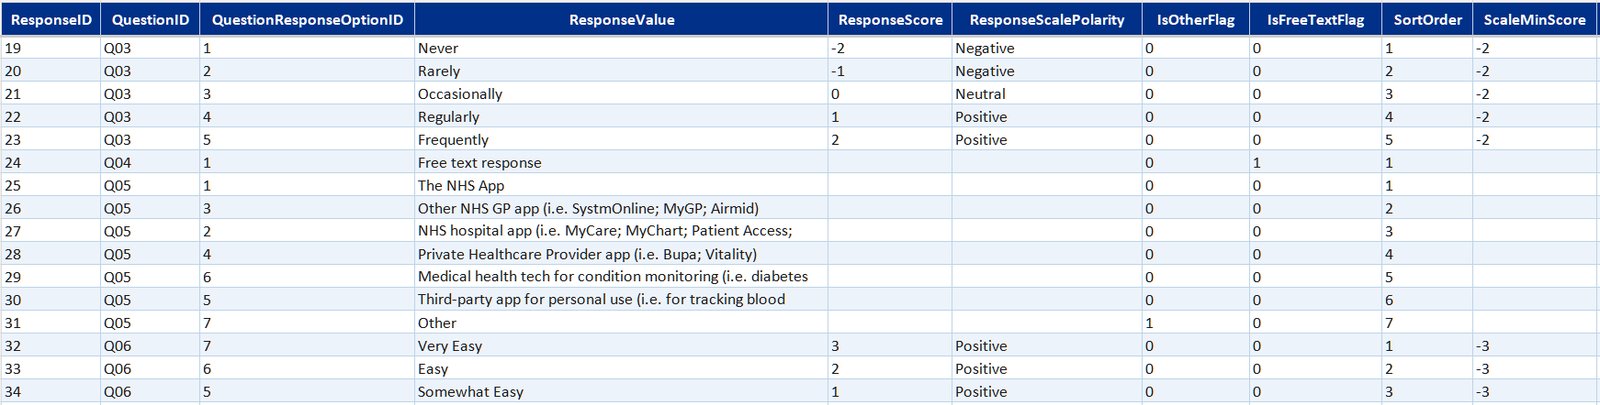
- DimQuestion and DimQuestionResponseOption—question definitions and the full set of valid response options, including likert scale labels
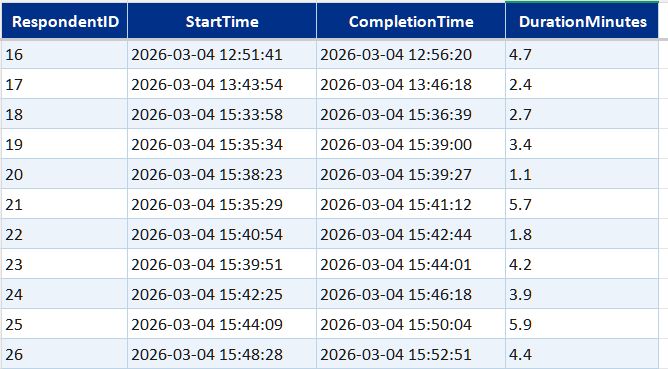
- FactSurveySession—one record per completed submission with timestamps
- Bridge tables (one per multi-select question)—link each respondent to each option they selected, across app usage, confidence statements, and two further multi-select questions
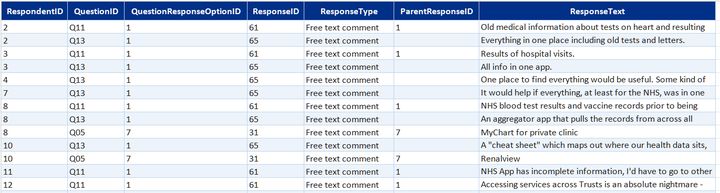
- FactResponseComments—free-text responses on personal experience and improvement suggestions linked back to the parent question and "other" selections that prompted them


After restructuring the raw survey data for analysis, I wanted to improve it with a Power BI semantic model / reporting layer. My target was parent/child question linking, engagement and respondent profiling, key phrase extraction and free-text response analysis.
I started by looking for a free LLM to run against survey responses and extract clustering and themes. One of the most popular options for this was all-MiniLM-L6-v2 (sentence-transformers, HuggingFace).
While working on this and stepping through tutorials, I decided to call the same LLM as a training model in Claude Code and ask it to run the process for me instead; so I added some API credits to my account and did this, then validated and augmented the output via:
- Adding and removing themes and stop words based on survey and question context
- Re-training "off" contextual analysis, clustering and sentiment for app and health-related content
- Highlighting missed connections between free-text responses and earlier responses to multi-choice, selection, or LikertScale questions
This added three new free-text response analysis tables to the model: FactSentimentAnalysis, FactKeyPhraseIndex and DimCluster.
Next step was to load the updated data into Power BI for further transformation, providing a chance to get to know Power BI's data modelling MCP Server which I hadn't had an opportunity to use at work before.
I installed and set up the MCP Server with Claude Code, read through the server documentation, and iterated to a final reporting layer with an additional date table, engagement and respondent profiling, scale sorting, and a _Measure table grouped into logical display folders. I also used the connection to step through and check DAX and PowerQuery calculations, which made validation and error-handling a lot easier.
This brought the data model to 18 tables + 2 calculated summary tables for scale sorting.
Newly added survey analysis tablesexpand
Sentiment and NLP analysisexpand
Semantic clustering using all-MiniLM-L6-v2 (sentence-transformers, HuggingFace), installed and run locally with Python, then iterated on using the Claude API (Haiku, Anthropic) in Claude Code to add sentiment scoring, theme classification, and key phrase extraction.
- FactSentimentAnalysis—sentiment scores per comment
- FactKeyPhraseIndex—key phrases extracted per comment
- DimCluster, DimThemeCategory, DimSentimentLabel—reference tables for cluster definitions, theme categories, and sentiment labels
Hypothesis evidence matrixexpand
A structured mapping of the four research hypotheses to the survey questions and evidence that support or qualify them.
- DimHypothesis—hypothesis statements with verdicts: two fully supported, two partially supported
- RefQuestionHypothesis—maps each hypothesis to the survey questions it draws on
- RefHypothesisEvidence—specific evidence items linked to each hypothesis
Sort and display helpersexpand
Reference tables controlling display ordering for categorical values in Power BI visuals—nothing analytical, just keeping the charts readable.
- SortLikert—display order for Likert scale response labels
- SortAccessFrequency—display order for access frequency categories
After receiving a few more batches of survey responses, I wanted to set up a survey data pipeline with a repeatable ETL process—enabling new responses to be added to the Power BI model with minimal manual intervention.
This started out as a flat CSV file → Excel workbook → Power BI process in Claude Code but after a few AI-powered mass extinction data events, I started re-developing this by using Claude Code + TMDL to build an automated documentation pack:
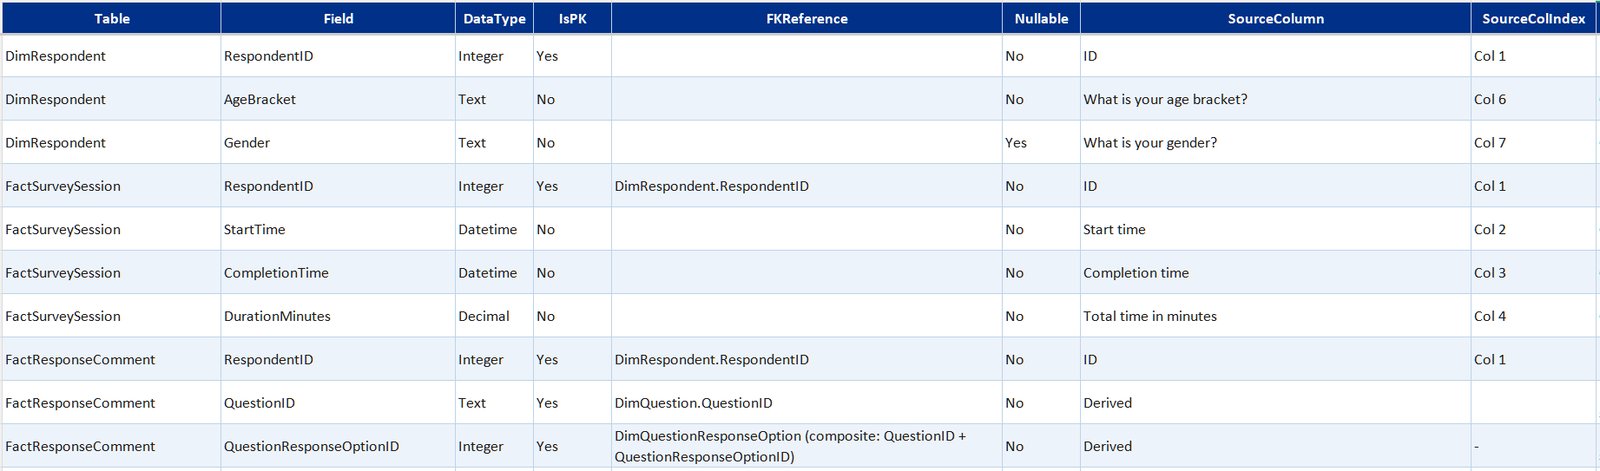
- Data dictionary—field definitions, data types, FK references, transformation rules, and source column mappings
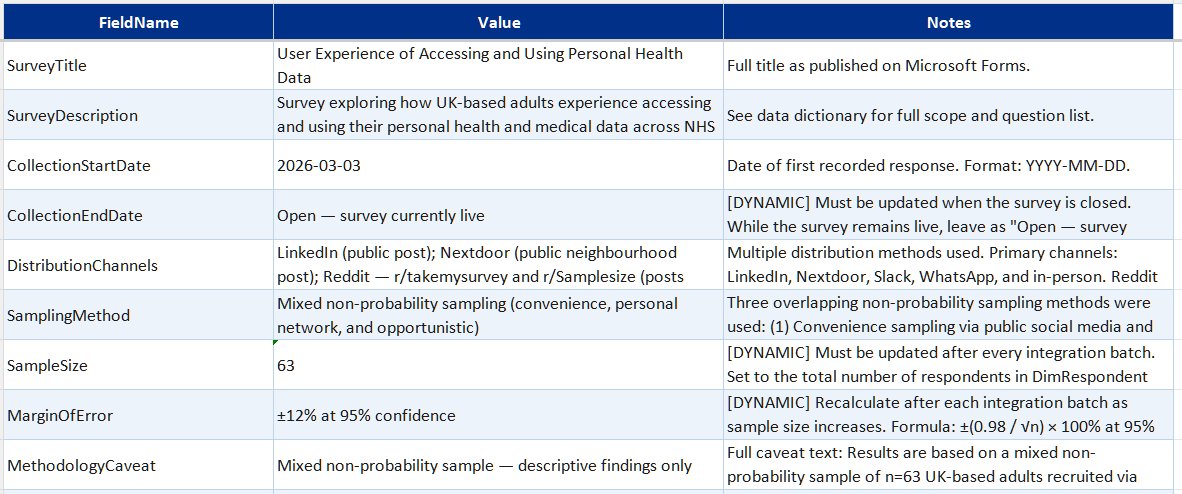
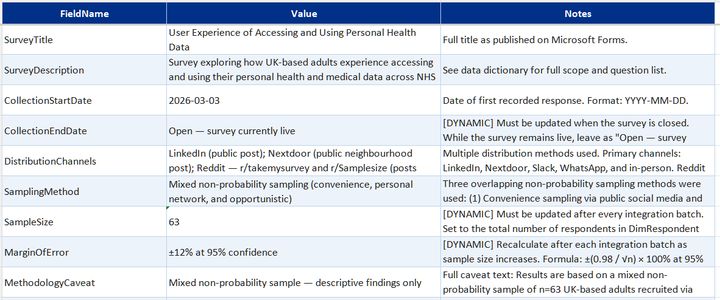
- Model metadata—survey configuration, version tracking, collection period, and schema versioning
- Attribute metadata—attribute roles and descriptions, relationships and interactions, PowerQuery and DAX calculations, previously implemented workarounds
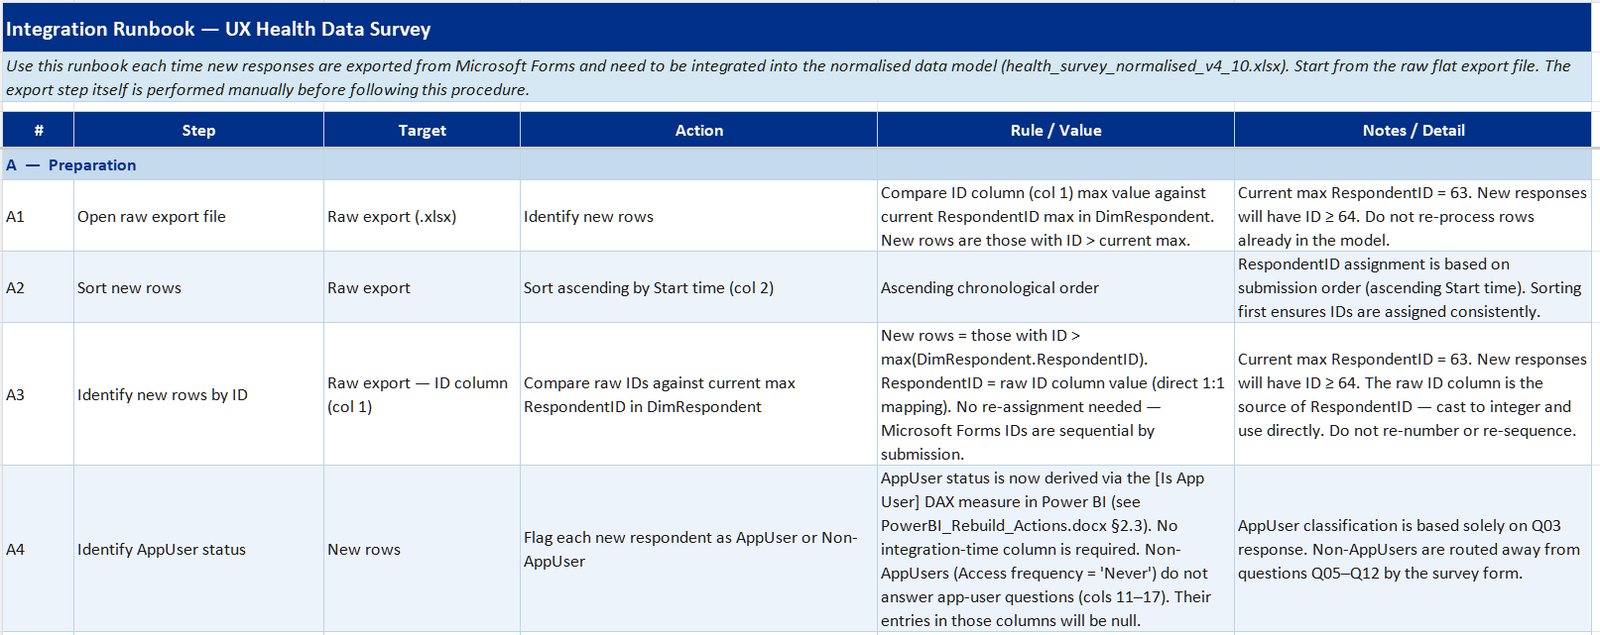
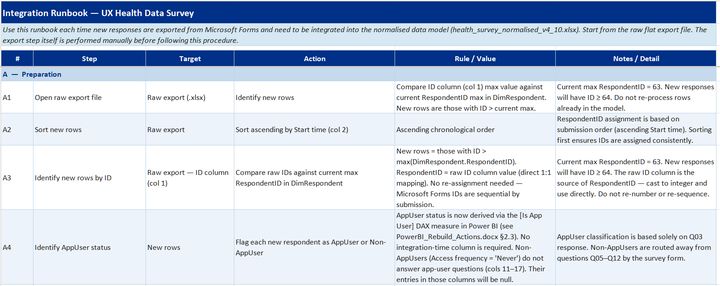
- Integration runbook—step-by-step guide for appending new responses, model refresh, and output validation
I now use this as skill-based training material for each new batch upload.
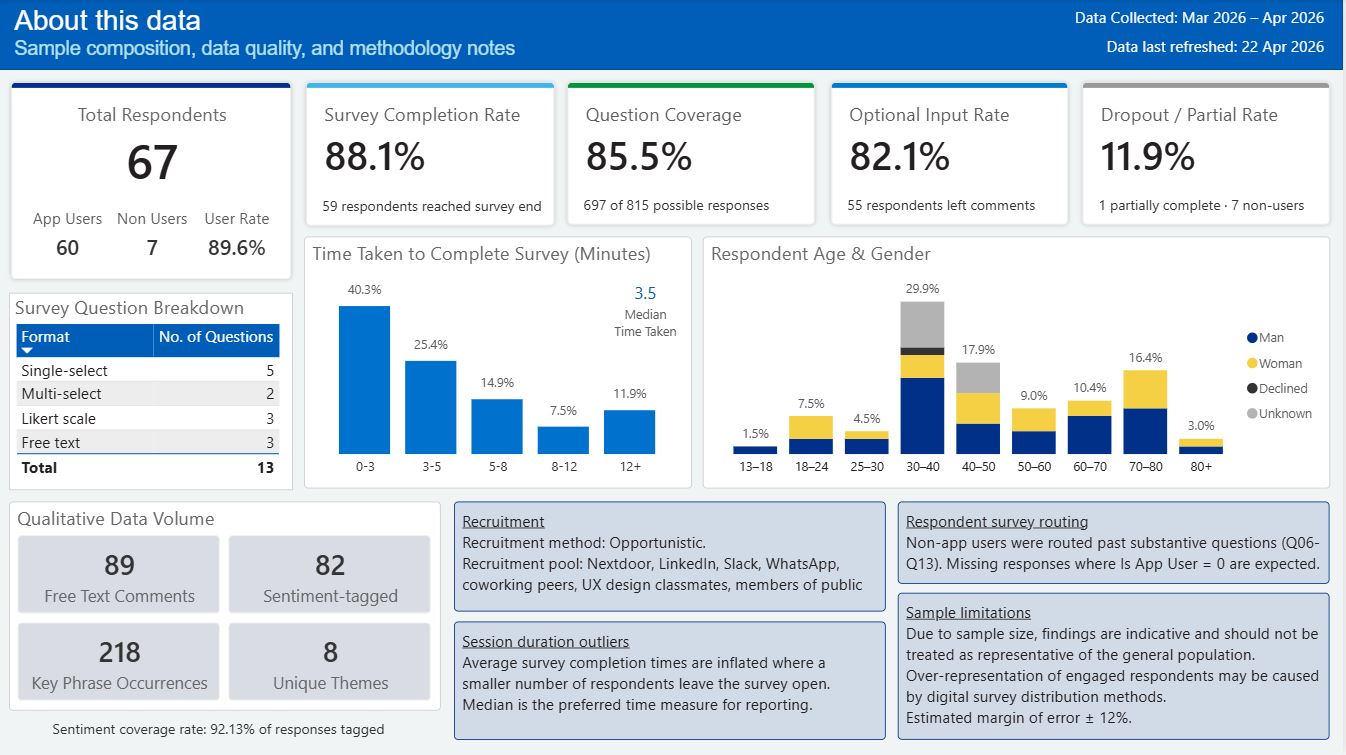
The survey data surfaced patterns across the respondent pool. Key findings are published to a Power BI dashboard covering app usage, ease of use, engagement segments, data confidence, and sentiment analysis on free-text improvement suggestions.
The results cover a broad age range (13 to 80+), with a decent spread across brackets, reflecting the range of people using NHS digital services.
Headline figures
Key survey research findings (as of 22/04/2026)expand
App usage patternsexpand
- 90% of respondents report using at least one healthcare application
- NHS App adoption is high but multi-app use is common
- 27% of respondents regularly or frequently access their health data
Ease of use and confidence in health dataexpand
- The NHS App is not consistently perceived as easy to use — ease scores are mixed, particularly among lower-engagement respondents (informs D2, D4)
- Respondents who find records easy to access report noticeably higher confidence in their health picture (informs D1, D2)
- 37% feel their personal healthcare view is incomplete, 28% find their overall health status hard to interpret, and only 25% feel they are seeing the full picture
- Multiple respondents reported copying health results into AI tools because they don't know how else to interpret them
Engagement and data ownershipexpand
- Respondents split into three engagement segments: Engaged (54%), Low Need (36%), and Non App User (10%)
- Engaged respondents show markedly better ease scores than Low Need and Non App User segments, with confidence in their health picture as the key differentiator
- Engaged app users are more likely to have raised a SAR, though the relationship is not uniform (informs D2)
- A meaningful minority have actively exercised their rights via subject access data requests
- Most respondents are unaware of their right to request their health records (informs D1)
Qualitative themesexpand
- The most common theme in free-text comments was wanting one place for everything—further evidenced by it being the highest-frequency cluster after NLP application
Survey results so far signal both a lack of adequate access to medical advice and how we could take advantage of technological advances to improve access to health information.
Click here to view the full survey analysis Power BI report.
Caveat: Given the survey sample size compared to national population sizes, these results should be treated as indicative rather than precise.

This passion project set out to target the most meaningful gaps in the current NHS app user experience. I identified three key personas during user research and these were supported by survey results:
- People managing pre-existing conditions (regular users with high stakes)
- People with complex or multi-setting care needs (fragmented records, multiple providers)
- People who've moved practices or been treated across different Trusts (gaps in their visible history)
Each persona shaped which journeys to prioritise and how far to simplify or expand the user experience across the redesign.
PM Priya M 30s · pre-existing condition expand
Early 30s · managing a long-term condition
NHS App + hospital portal
"I end up screenshotting my results and putting them into ChatGPT - I know it's not accurate but I don't know what else to do."
When I receive a new thyroid result, I need to see how it compares to previous readings over time, so I can tell whether my levels are improving or declining without having to call the GP
When a result comes back borderline or abnormal, I need a plain-English explanation of what it means for me specifically, so I can decide whether to act without relying on tools I know aren't reliable
When an abnormal result appears in my record, I need to know whether my GP has seen it and what, if anything, is planned next, so I'm not left uncertain about whether my care is progressing
DC David C 40s · multi-setting care expand
Mid 40s · complex multi-setting care
NHS, private and third-party apps
"Something that brings my medical data across all systems into one place, that me and anyone involved in my care can easily access, understand and proactively act upon."
When I've had a specialist appointment or scan, I need to find where the results actually ended up, so I know they're accessible and haven't been lost between systems
When I need a complete picture of my health, I need to pull records from NHS and private systems into one grouped view, so I don't have to cross-reference five separate apps
When someone new becomes involved in my care, I need to share the same complete history I can see, so they're not starting from an incomplete record and I'm not having to bridge the gap myself
BT Barbara T 70s · gaps in history expand
Mid 70s · occasional access
NHS App only · gaps in historical record
"Sadly it's not about using the tools - it's the systematic programming. I haven't got the computer patience to request it. That's why I give up so easily without a fight."
When I want to check a result or health event from earlier in my life, I need to find records going back further than ten years, so I can access my full history rather than just what the NHS App makes available
When I encounter clinical language in a result or letter, I need to understand what it means without going somewhere else to ask, so I don't have to visit a pharmacist or give up before finding the answer
When I know my record contains an inaccuracy, I need a way to get it corrected, so my health history accurately reflects what actually happened rather than carrying errors I've been unable to fix
Reviewed the current patient experience across test results, appointments and medications, looking for confusing journeys, missing context, or dead ends.
A recurring theme was that NHS digital services have grown incrementally across separate systems and databases—which, from a user's perspective, means gaps, duplication and friction that no single app currently resolves.
PM Priya M pre-existing condition · regular user expand
- Results shown with no explanation or trend view
- Imaging results rarely accessible digitally—when present, MRI letters are often missing or pixelated
- Limited health status visibility—patients describe the current view as giving them “very little in the way of health status”
- No in-app evidence that a result has been thoroughly reviewed—patients cannot tell whether an abnormal result has been given adequate attention, which creates avoidable anxiety
- Not always aware that data was accessible at all—“I didn’t know you could do that”
DC David C multi-setting care · complex history expand
- Cross-Trust record access is a significant friction point—which reduces accessibility for many, including the elderly or less internet-ready
- Hospital results often not pushed to the NHS App—they exist only in the trust’s own portal
- Limited data flow between hospital and GP systems—results from secondary care are not consistently visible to GP practices, leaving patients to bridge that gap themselves
- Clinical correspondence is largely clinician-to-clinician—discharge summaries, referral letters and consultant notes are often not understandable to the patients they are about
- Private clinic links (Egress) expire before records are saved
- 5 separate apps—none talk to each other
BT Barbara T occasional access · gaps in history expand
- Can’t find historic records in NHS App
- Records disappeared when changing GP practice
- Record has inaccuracies she cannot get corrected
- Friction at multiple stages leads to task abandonment—“it does my head in, I give up easily”
↔ Cross-cutting all three journeys expand
- Third-party app users are among the most engaged patients—yet their data is often siloed, with no accepted standard for sharing it with clinicians or pulling NHS data into their tools
- No accepted standard for third-party health data in clinical settings—real data from other care settings is not consistently acknowledged but alternatives or re-testing are often not provided either, reflecting the absence of an integration pathway rather than individual clinical need
The design challenge was working out how far to reduce those gaps without creating something completely unfeasible based on system data as it exists currently. This fed into the information architecture for the wireframes and a decision to focus on making existing personal health data more accessible through:
- Plain-English health information that's easy to navigate
- The option to switch between summary and detailed diagnostic data
- Improved test result context and trend analysis
- A social-style "Health Insights" feed for lighter-touch users who don't want to search for results
A key design choice I made at this point was having all key healthcare app user flows start from a single, easily accessible point—like a home page dashboard—to reduce the number of clicks needed to find a specific common route.

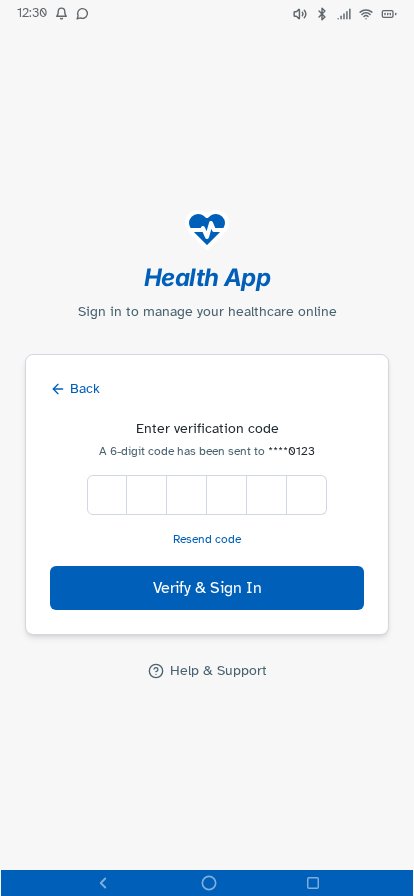
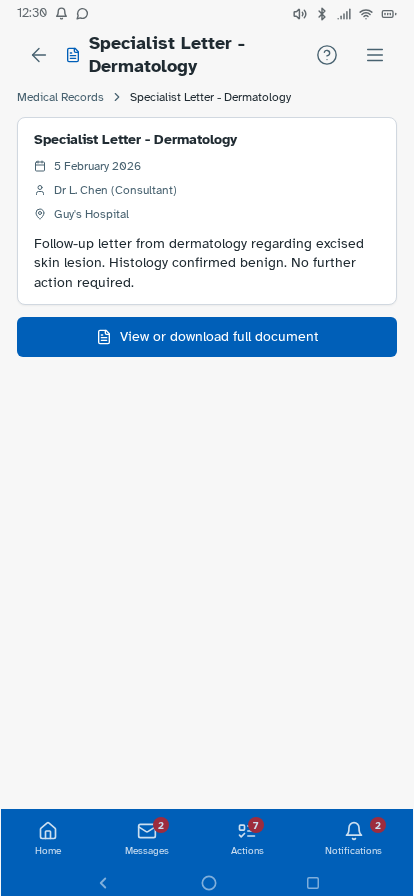
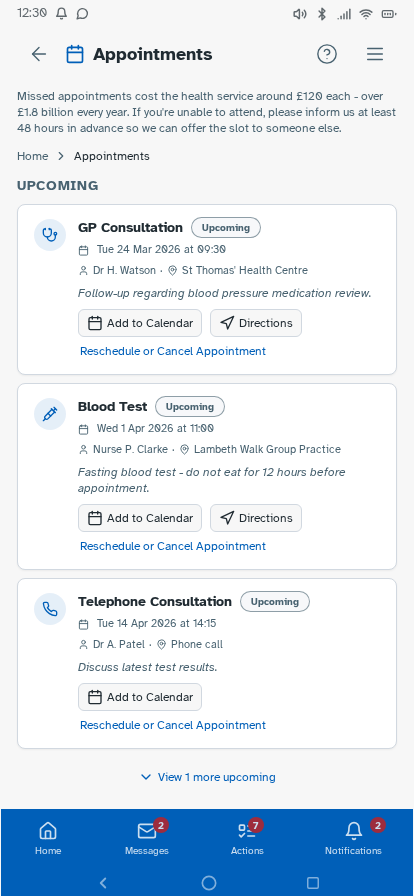
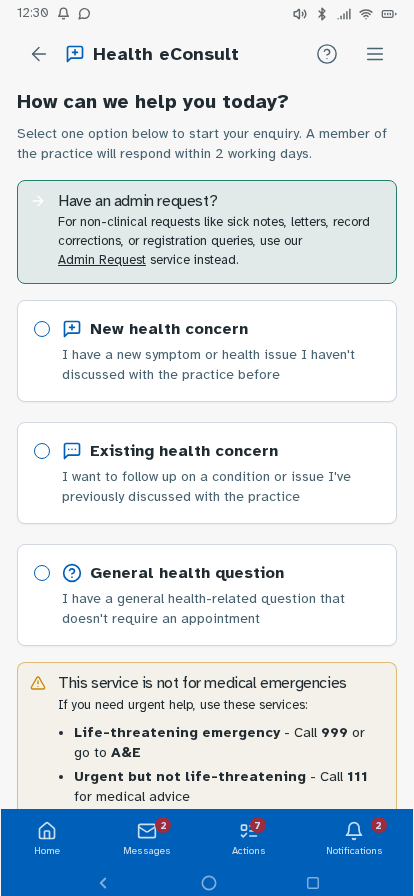
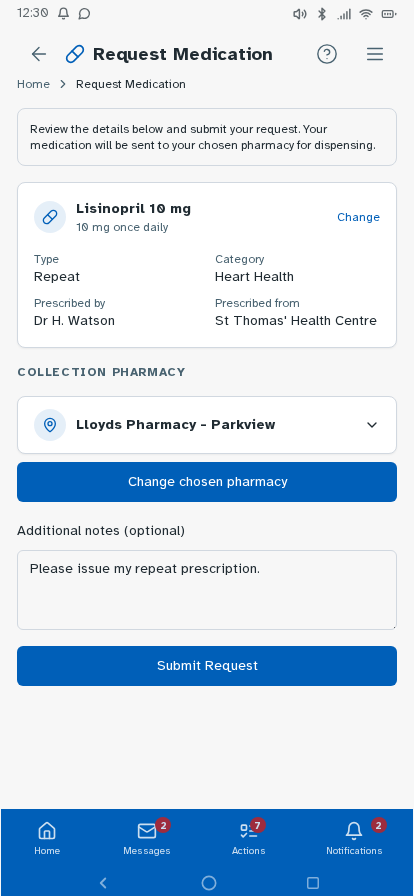
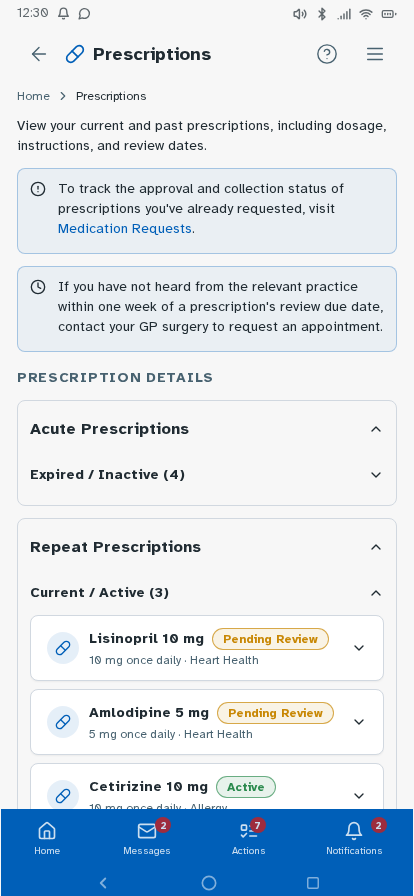
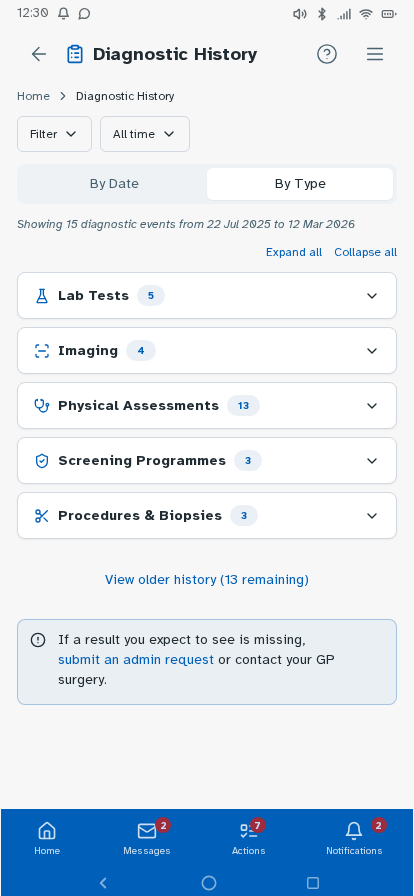
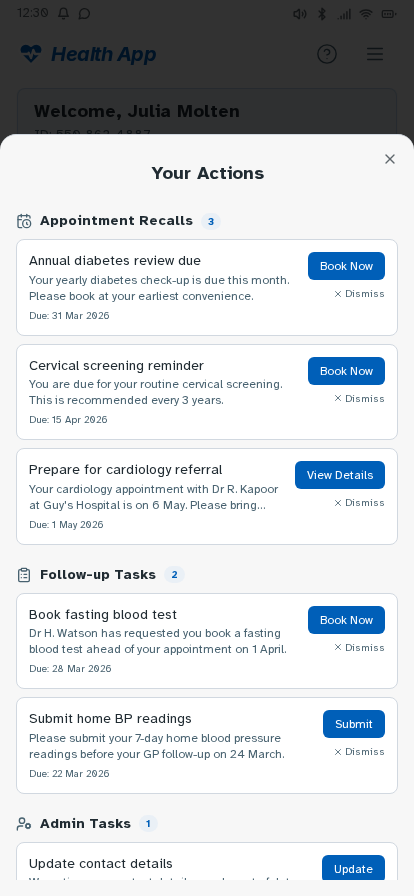
Personal experience and user research has established where friction sits—fragmented records, unclear information origins, difficulty interpreting results—but can't test whether a redesigned experience would resolve these. I followed this up by building a prototype, with each design decision mapped to a known pain point or specific survey finding, and preference and usability testing designed around producing further evidence that the survey can't provide. Built in Lovable, iterated with Claude Code and ChatGPT, version-controlled on GitHub and deployed via Cloudflare Pages—as a working prototype rather than static Figma screens, so it could be tested as a real app experience. Key decisions: authentication modelled on real NHS app verification but with simpler features—two step verification via NHS number, date of birth and one-time passcodes to phone or email, or biometric login options displayed directly underneath—establishing the prototype as a recognisable patient-facing experience from the first screen; a home dashboard with customisable health summary indicators; a Health Insights feed translating clinical observations into plain English, grouped by month; diagnostic history filterable by date or type; visual reference range bars on test results so it's immediately clear where a result sits; a single patient summary consolidating conditions, medications, allergies and immunisations; an appointments view separating upcoming from past consultations; active prescriptions alongside a dedicated medication request flow; an eConsult journey for raising new GP consultations with structured symptom collection; a medical records view consolidating documents across GP, specialist, and hospital sources—letters, referral correspondence, reports, and subject access data in one filterable list, organised by date or document type rather than by provider—so patients can locate records and verify completeness without knowing which system holds them (D1, D3, D4); and mock patient data drawn from multiple provider types—GP surgery, other primary care, and acute hospital—to demonstrate the unified record hypothesis against a realistic multi-source dataset. Navigation follows how patients actually move through their health—summary to filtered results to individual marker history with trend charts—without losing your place.


Tested the prototype with structured tasks across the core journeys—finding a specific result, interpreting a borderline marker, locating documents from a past appointment, and drilling from a summary indicator through to the underlying data. Findings led to changes in navigation labels, the Health Insights card layout and the breadcrumb structure on deeper pages.
A fully navigable prototype covering the core NHS app journeys—test results, diagnostic history, health insights, appointments, medications, eConsult and patient summary—designed around how patients think about their health, rather than how systems are structured.
Each hypothesis maps directly to a design decision: records in one place regardless of origin; results in context through reference ranges, plain-English summaries and trend data; navigation that follows natural decision-making; and no visible split between GP and hospital records.
This is an ongoing personal project—workings, testing outputs and artefacts added as it develops.
End-to-end UX redesign of the NHS app: survey research, personas, journey mapping, a working prototype and usability-tested navigation—addressing fragmentation, clarity and patient confidence across the full health record experience.